-
High Expectation
The man passed by a shop selling jigsaw puzzles and bought one for his 5 year old son. He can’t wait to give it to his son Jordan. Jordan had never played with one before. Upon reaching home, he went straight to Jordan’s room to show him his favourite cartoon character printed on the box. Jordon’s eyes brightened up. The man quickly unwrapped the box and poured the 500 pieces of jigsaw puzzle on the floor and left him to complete it. I bet you don’t give your son a 500 pieces puzzle to start with. You would probably give him 10 piece puzzle and show him how to put…
-
Is it worth it?
My bluetooth ear piece cannot connect to my laptop. I tried to turn on and off, reboot the computer, delete and set up the device again. All didn’t help. I googled for the driver and click on the support link. It went to a 404 page, meaning that the page cannot be found. I called Plantronics and after a long long wait, I got to someone. It was the wrong line. I was re-directed to another line and the wait started all over again. When I finally got to talk to the right person and explained to him what happened, the line was cut off before the customer service guy…
-
How to create a professional employee evaluation report without repetitive copy and paste
-
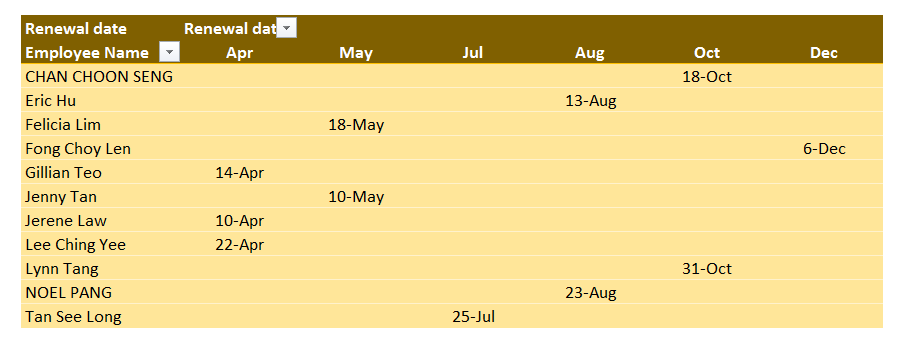
How to create a re-certification report
Create a re-certification report using Pivot Table is easy. Watch the video below to find out. If you like what you see, help me like the post and share it with your L&D friends. Reports are easy to create, if and only if you have the correct set of data to work on. In our courses, we use the iiMAP framework to create any report that is easy to maintain. It is not complicated but requires you to possess a certain level of skills in 3 areas, Excel, Database knowledge and your domain knowledge (in this case L&D). We have public runs (Fixed outline) customized courses (learn what you need…
-
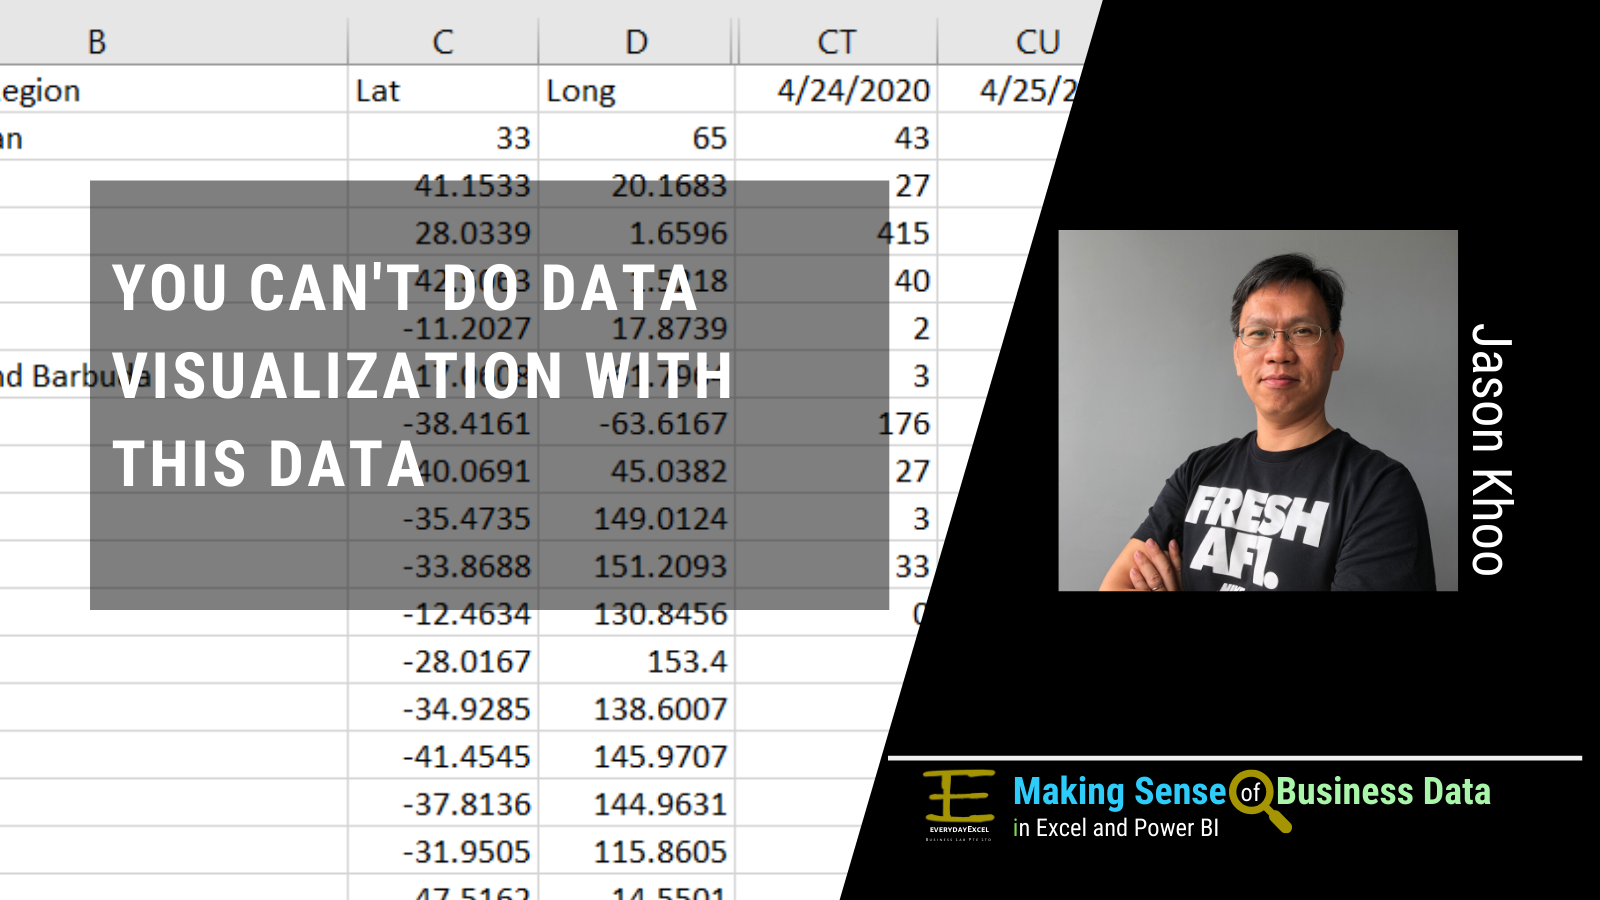
You can never create a successful data Visualization with this data
Source: https://data.humdata.org/dataset/novel-coronavirus-2019-ncov-cases (The Humanitarian Data Exchange) This looks like a great set of data at one glance. Every detail seems to be there. But if you wish to create a data visualization project with the data, you will surely fail. This is because the data is not in Pivot Table friendly layout. What Pivot Table friendly layout has got to do with Data Visualization? You see, Pivot Table was designed for basic data visualization. Those who were successful in creating a Pivot Table did in in less than 3 minutes. Most of them did not know that they were using Pivot Table friendly data and therefore managed to do it…
-
3 Types of BGR you can find in Databases
-
3 Major Difference between Pivot Table and Power Pivot Table
1a. Pivot Table can only accept a single source of data. 1b. Power Pivot Table can accept multiple sources of data. 2a. Pivot Table can only do simple summary such as Sum, Count, Max, Min 2b Power Pivot Table can do complex calculations 3a. Pivot table can only accept data from the entire source (worksheet) 3b Power Pivot Table let you pick choose the columns from source to be included in the report
-
3 Presentations You Don’t Know You Can Do In Pivot Table
1. You can create Bar Chart in Pivot Table Bar Chart in Pivot Table 2. You can perform unique count without calculations Unique Count in Pivot Table 3. You can present dates in the report Present Dates in Pivot Table
-
3 core skills you will acquire in our business data training
I am conducting our most popular Excel course titled “Hidden Secrets of Data Analysis in Excel” next week on 5 & 6 March 2020. It is not a typical Excel course which just showed you how to use some popular functions and formulas in Excel. This “Hidden Secrets” course will also impart skills on how to manage your database, a skill that is not available in most if not all Excel courses. To be able to prepare your reports, you need to have at least a basic sense of how databases worked. This will help you manage your data more efficiently, create more dynamic Pivot Table for analysis and reporting.…
-
3 New Ways to present a Hair Salon Sales Dropped by 50% in Excel