You can never create a successful data Visualization with this data


Source: https://data.humdata.org/dataset/novel-coronavirus-2019-ncov-cases (The Humanitarian Data Exchange)
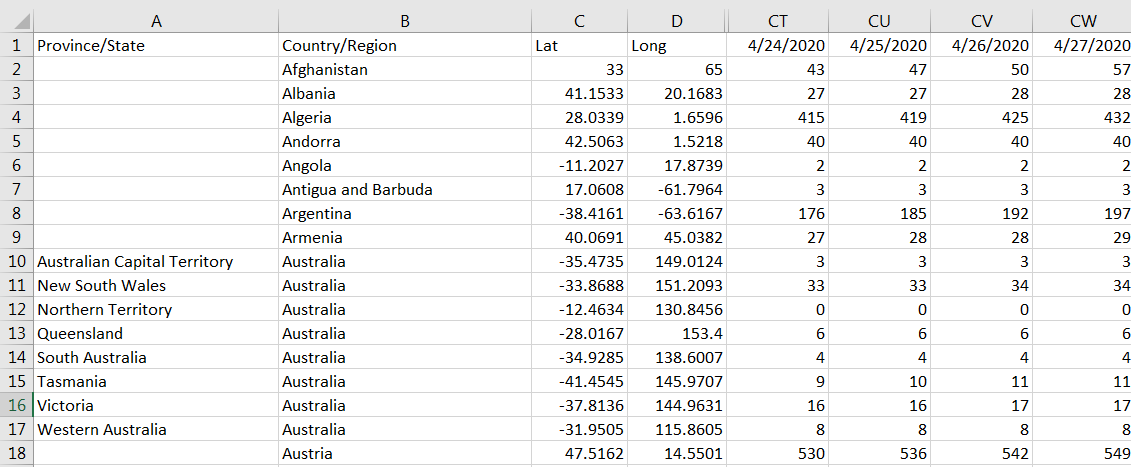
This looks like a great set of data at one glance. Every detail seems to be there. But if you wish to create a data visualization project with the data, you will surely fail.
This is because the data is not in Pivot Table friendly layout.
What Pivot Table friendly layout has got to do with Data Visualization?
You see, Pivot Table was designed for basic data visualization. Those who were successful in creating a Pivot Table did in in less than 3 minutes. Most of them did not know that they were using Pivot Table friendly data and therefore managed to do it for some but not others. The first experience was not replicated.
Others failed not because they are bad with data. It’s because the data they were using was not in Pivot Table friendly format. Therefore, they failed to create one.
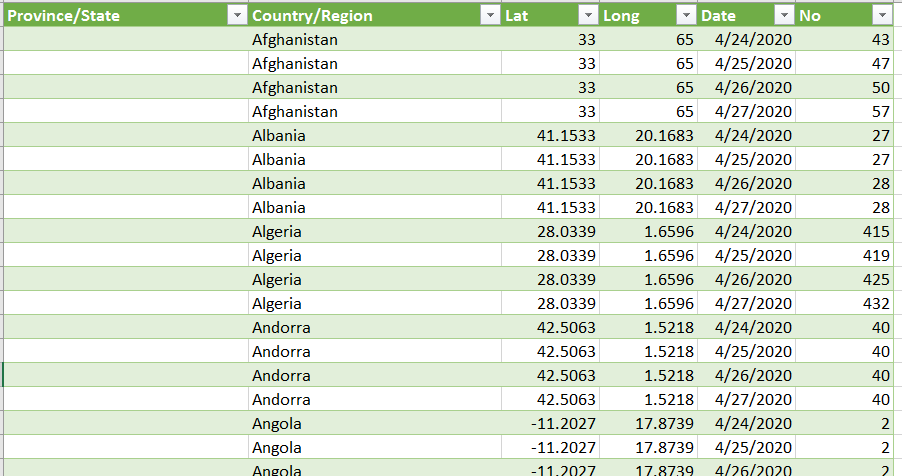
Here’s how a Pivot Table friendly layout looked like.


To be be able to create a successful Pivot Table or Data Visualization Project all the time, you need to know first what is a Pivot Table friendly layout before you jumped into data visualization. That’s where I can be of help to you. If you wish to be successful in creating a report whether it is in Pivot Table or for Data Visualization, you need to attend our course. It is happening on 19& 20 May 2020, 9am to 5pm (SGT), online. Drop me a text for more details.


