excel courses
In today’s digital era, datasets have evolved from small and manageable to colossal and complex, requiring more advanced techniques than traditional worksheet functions. As the demand for insightful reporting and real-time analysis increases, data analytics emerges as a game-changer, empowering professionals like you to navigate the vast ocean of data effortlessly.
Our courses are thoughtfully designed to equip you with the essential knowledge and practical skills needed to not only store and string data together but also to unleash its true potential through instant calculations and data-driven decision-making. We recognize that in this data-driven world, proficiency in data analytics is no longer optional, but a necessity for success in any field.
Whether you are a seasoned Excel user seeking to upgrade your skills or an aspiring data analyst eager to harness the power of Power BI, our expertly curated courses will cater to your needs and aspirations. Backed by years of experience and industry expertise, we have tailored these courses to ensure you gain a solid foundation in data analytics, from data storage and manipulation to generating comprehensive reports and dynamic dashboards.
Through our user-friendly and hands-on learning approach, you will develop the confidence to simplify reporting processes and unravel insights that were once buried deep within overwhelming datasets. Our commitment to your success extends beyond the course completion; you will leave equipped with the tools to analyze data effortlessly, chart its course, and make informed decisions that propel your career forward.
Join us on this exciting journey into the world of data analytics, and let us empower you to transform data into your most potent ally. Discover the power of Excel and Power BI as your tools to unravel the secrets within data, providing you with a competitive edge in today’s data-driven landscape. Get ready to dive into the limitless possibilities that data analytics offers
Hidden Secrets of Data Analysis in Excel
This course is specially designed to help executives and managers who are currently preparing their reports using manual calculations, auto-filter, and wish to learn how to prepare and analyze their reports faster using Pivot Table, one of the best tools hidden in Excel.
At the end of the course, they will be able to skillfully create and design their reports using worksheet functions, Pivot Tables, Pivot Charts, and Dashboards.
The skills acquired mark the start of their journey in Data Analytics, a capability that many companies hope to build for the digital economy. Learn More
Secret Hacks of Excel Data Analytics for PMET

This course is an upgrade from Hidden Secrets of Data Analysis in Excel. The course will train you on the new Data Analytics functions added recently to Microsoft Excel and show you how to make use of them effectively for Data Analytics.
At the end of the course, you will be able to confidently apply data analytics skills to your job and add value to your organization. At the same time, you will be the first to learn how to use the new functions in Excel to work 90% faster. Learn more.
Data Visualization with Power BI
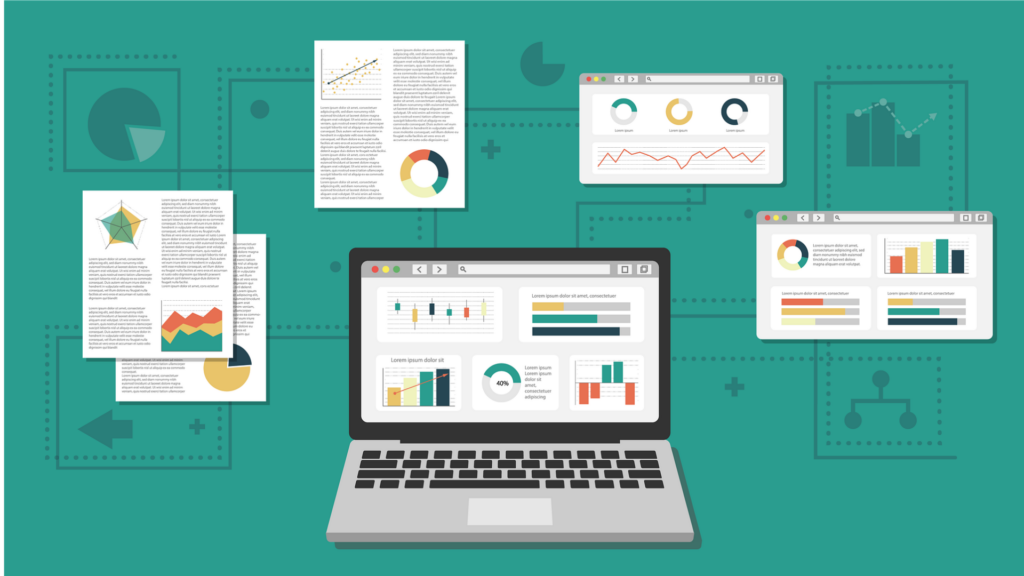
Power BI is a data visualization tool for analyzing and presenting performance and progress updates effectively to management as compared to simple static tables of numbers. With Power BI, you can create an interactive dashboard to gain a better understanding of the data you own.
At the end of the course, they will be able to create an interactive dashboard for reporting and presentation and tell a story using the visuals created. Learn More
Automate Sales Incentive Calculation with Excel Power Query and Power Pivot
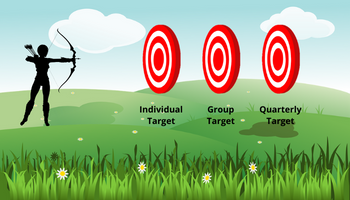
This course is suitable for Finance, HR, admin, and Sales Admin professionals who are involved in complicated sales incentive calculations involving different commission levels for brands, locations, and quarterly targets.
At the end of the course, you will be able to make use of different elements in Power Query, compare the sales between months or years using Power Pivot, distribute the sales incentive between salespersons and present the different sales incentives by salesperson. Learn more
Grow Your Profit Through Data Analytics and Data Modelling
This course is specially designed to help executives and managers who already know Pivot Table and feel that they are not proficient with it yet. In this course, we will reveal the secret of creating highly efficient Pivot Tables that are instantly updated month after month.
At the end of the course, they will be able to use Pivot Table to compare 2 sets of values, calculate growth/variance within Pivot Table, and learn how to make use of the Power functions in Excel, namely Power Query, Power Pivot.
The skills acquired help you navigate the different capabilities of Data Analytics and prepare you for the new data-driven economy. Learn More
Productivity Boost: Top 50 Excel Tips and Tricks
This course is for existing Excel users who are seeking shortcuts and tricks to speed up what they have already done. The tips and tricks are easy to pick up and make working with Excel simple.
At the end of the course, they will be able to immediately apply these tricks back at work. There is no macros/VBA/programming involved in these tips and tricks. Learn More
Unleash the Power of PowerPivot

This program is a deep dive into advanced Pivot Table by Microsoft. In this course, you will learn all the essential DAX functions to help you create the most robust and instantly updated dashboard.
With PowerPivot, creating calculations within Pivot Table is no longer a wishlist. You can now compare 2 different sets of numbers, show the differences, find percentages based on the full total, calculate YTD, with a click of the button. Learn More
Learning the Magic of Macros (VBA)

Learning the Magic of Macros is a coaching program designed to help business professionals automate their data collection and distribution activities. The main objective is to create highly accurate and reliable data sources for reporting. Through the program, the participants are coached to create their own macros that they can customize and use immediately upon completion. Learn More