3 skills you need to Excel in Reporting
1. Data source
Not all the data comes nicely in an Excel worksheet. Some come in csv format, text or linked to some data sources. If you are lucky and there is IT support, you can get the IT guys to organize the data nicely for you. If not, there is a bit of moving around to get the data in the right layout. Splitting and grouping of the data is usually done within Excel and you probably have toknow some Excel formulas or functions to get this done efficiently. If not, goodluck to your copying and pasting.
2. Analysis
Once you have gotten the data in the right format, you are ready to analyze it. Pivot Table is usually the tool for you to perform your analysis. If it is not good enough because there are somecalculations to do, then you have to use PowerPivot for this.
Analyzing also means organizing the data and find meaningful patterns that help you understand the data better. For example, you can identify the top 5 sellers, top 5 products, top 5 categories, etc. Analysis involves knowing the finer details of the top 5.
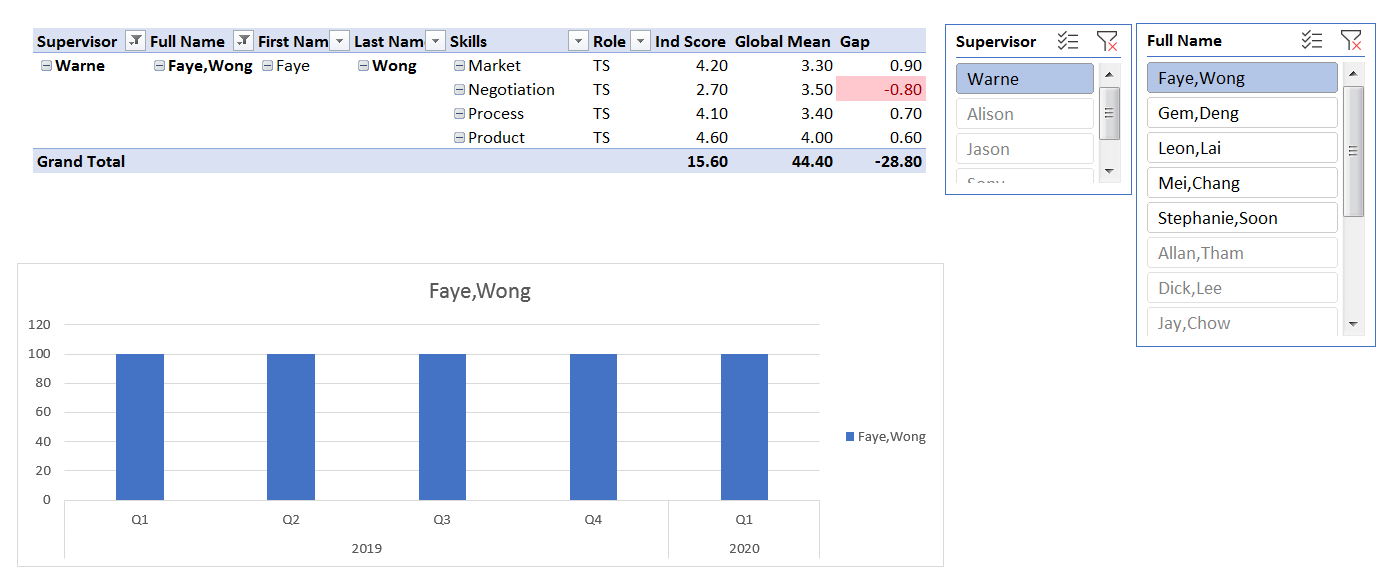
3. Reporting/Presentation
Your audience, usually the management, is not interested to know everything about the data. They are more interested in your findings and the key points of the data. Presenting interesting charts to catch your audience attention and the key statistics so that they could remember the numbers easily is the main focus of this section. If you can achieve this, the time you spent analyzing the numbers will not be wasted.
You May Also Like

3 Presentations You Don’t Know You Can Do In Pivot Table

3 Major Difference between Pivot Table and Power Pivot Table