Mastering Data for Business: Leverage Excel for Strategic Insights, Drive Growth
  • Case Studies
  • Data Challenge
  • Our Courses
  • Our Customers
  • Testimonies
  • Contact Us
  • Case Studies
  • Data Challenge
  • Our Courses
  • Our Customers
  • Testimonies
  • Contact Us
  • Pivot Table Friendly data

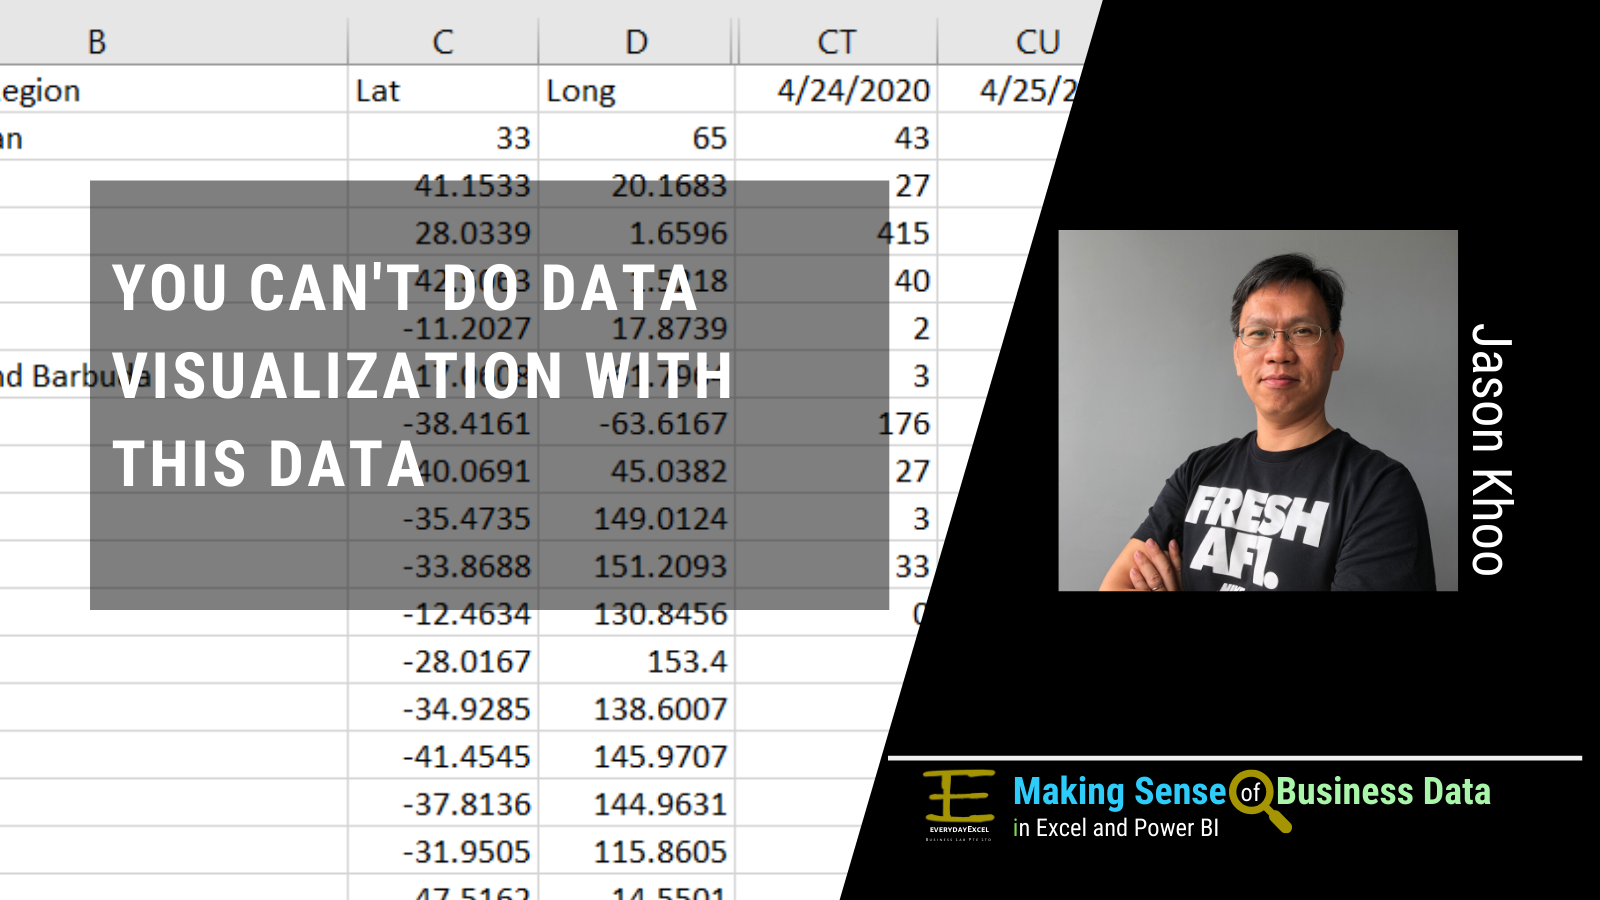
    You can never create a successful data Visualization with this data

    Source: https://data.humdata.org/dataset/novel-coronavirus-2019-ncov-cases (The Humanitarian Data Exchange) This looks like a great set of data at one glance. Every detail seems to be there. But if you wish to create a data visualization project with the data, you will surely fail.  This is because the data is not in Pivot Table friendly layout.  What Pivot Table friendly layout has got to do with Data Visualization? You see, Pivot Table was designed for basic data visualization. Those who were successful in creating a Pivot Table did in in less than 3 minutes. Most of them did not know that they were using Pivot Table friendly data and therefore managed to do it…

    read more

    You May Also Like

    Finding a Public Health Preparedness Clinic near you with an interactive map

    February 19, 2020

    What is Business Data?

    February 12, 2020

    Pivot Table with Percentage of Sales

    December 1, 2020

Our Courses

Unleash the Power of Excel in Procurement and Supply Chain Management. Join our Masterclass to Drive Growth and Gain Strategic Insights.
Learn Excel with a goal in mind. With a specific goal, it is easier to remember what you learn and apply the functions to your work. This is how we have designed Hidden Secrets of Data Analysis in Excel
© 2007-2025 everydayExcel Business Lab Pte Ltd
ashe-child Theme by Jason Khoo.