
sg property prices
SG Property Dashboard
There are 2 pages to the report. The first page shows the overview of the property prices. You can choose to see the price per square foot by floor level and by year.
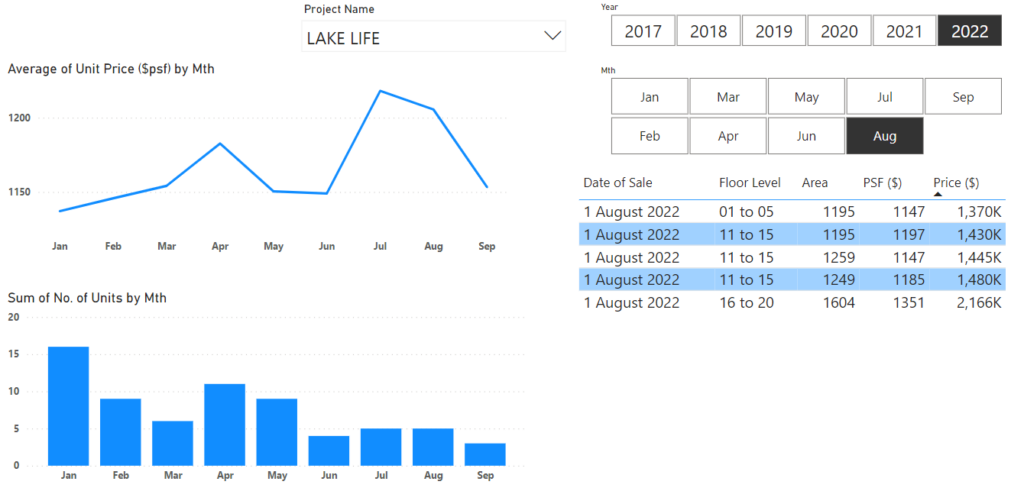
The second page shows the prices for a specific condo. You can see the prices for the month and the number of units sold for the year. It also lists the sales for the condo in that selected month.
Currently, the report only shows condominiums and executive condominiums for district 22. If you wish to see other districts, drop us a note and we will include it in the report.
For mobile view, click this Power BI report view
You can also read the report in this browser below.