pnl
All accountants will tell you that this is not possible to create the Profit and Loss (PnL) Statement using a Pivot Table.
Some accountants might even argue that there is no need to create the Profit and Loss Statement using a Pivot Table. Just present it in a simple spreadsheet would have been sufficient.
As a data analytics trainer, I have to disagree with them. Yes, the Profit and Loss Statement they have generated would have served their primary purpose, that is, to present the financial result of the company. But the story doesn’t end there.
Why do you want to create the Profit and Loss statement using a Pivot Table?
While the management team is interested to know whether the company is making money so far, they are also interested to know:
- Is the company is performing better this month as compared to the past few months?
- How is the company doing this quarter versus the last quarter?
- Is the company performing better because of one business unit or all business units?
- A summary first and details later.
To answer all the questions, they would have to refer to many different reports to get the answer. This can be quite confusing especially if they have ti toggle between reports to get the full picture. And of course, for the accountants, they would have to prepare all the reports to meet the needs of the management. Maybe that’s the reason why accountants are always so busy, referring to multiple reports to make sure that all the numbers tie to one another.
But with a single Pivot Table, all these questions can be answered instantly. In fact, management can choose the report they want to see and follow the flow of the initial report. And they are able to compare the different business units all within the same report giving better clarity of the financial health of the company. Here is what a Profit and Loss Statement created with Pivot Table can do.
A Profit and Loss Statement
Why accountants cannot create a Profit and Loss Statement using Pivot Table?
The first answer is that they lack the skill. Accountants don’t really attend Excel training in Data Analysis. They are likely to attend training in accounting standards, audits, accounting systems, everything except Excel Pivot Table
Even if they do attend an Excel training, they are likely to attend one created by accountants who think like them. And because of that, they are likely to arrive that the conclusion that Pivot Table cannot create a Profit and Loss Statement. And this is true for the following reasons.
For the first group, they couldn’t do it because their charts of accounts were organized wrongly. What they did was to put the first level and second level headings together with the third level. These 3 levels should be separated.
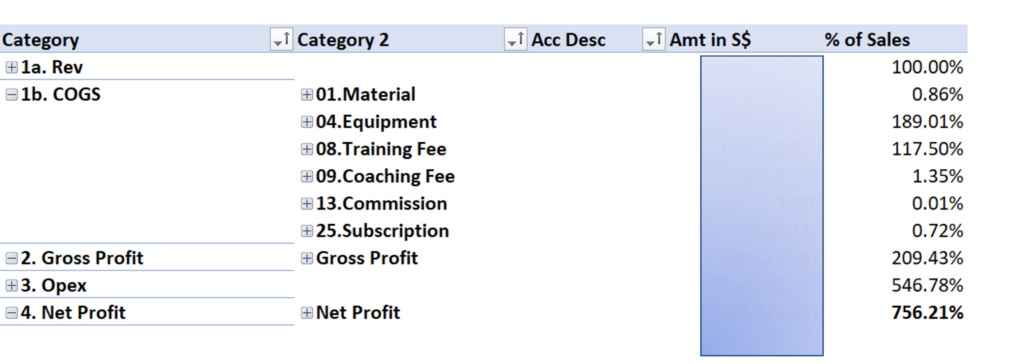
The second group who separated the 3 levels of the chart of accounts into 3 different columns still couldn’t do it. When they tried to create the Pivot Table, they would be able to group the Sales, COGS, Opex all together but they would not be able to put 2 important lines into the income statement, Gross Profit and Net Profit.
A normal Pivot Table cannot create the 2 lines Gross Profit and Net Profit. You need to use Power Query, a new function in Excel.
The 3 important steps you have to do in Power Query are,
- Pivot the Sales, COGS, and Opex.
- Create the Gross Profit and Net Profit Columns. Gross Margin and Net Margin can be added in this step too.
- Unpivot the 5 columns: Sales, COGS, Gross Profit, Opex and Net Profit.
It is quite simple even though it sounded complicated. You will definitely get it after a few tries.
Instead of putting the Gross Margin and Net Margin in step 2, I made use of Power Pivot to create a measure to present the line items as a percentage of Sales and place it on the right side of the line item within the Pivot Table.
Power Query is not available in other spreadsheet programs.
Check out our course on Power Query and learn how to create your Profit and Loss Statement in Pivot Table now!