self-assessment power bi
Diana’s Quest for Power BI Clarity

As the Learning & Development Manager of her company, Diana was responsible for finding and recommending training programs to help staff members grow. Recently, many staff expressed interest in learning Microsoft Power BI to better visualize and analyze data. The problem was that Diana herself wasn’t familiar with the tool and had no idea how to assess their skill levels or how to guide them towards effective training. The staff had been learning in a haphazard way and needed a structured approach to gauge their progress.
Without a clear understanding of Power BI functions, Diana felt uncertain about how to proceed. Recognizing this gap, she reached out to Jason, a known Power BI expert and trainer. She explained her challenge: “The staff doesn’t know how to label their Power BI skills, and neither do I. They recognize some functions they’ve used, but they need a proper assessment to gauge where they stand.”
Jason listened thoughtfully, then assured Diana he could help. Over the next few days, he crafted a simple yet effective self-assessment framework that divided Power BI proficiency into distinct levels, from beginner to expert. The assessment would allow participants to identify their current level and create a roadmap for their learning journey.
Jason’s Power BI Self-Assessment Framework:
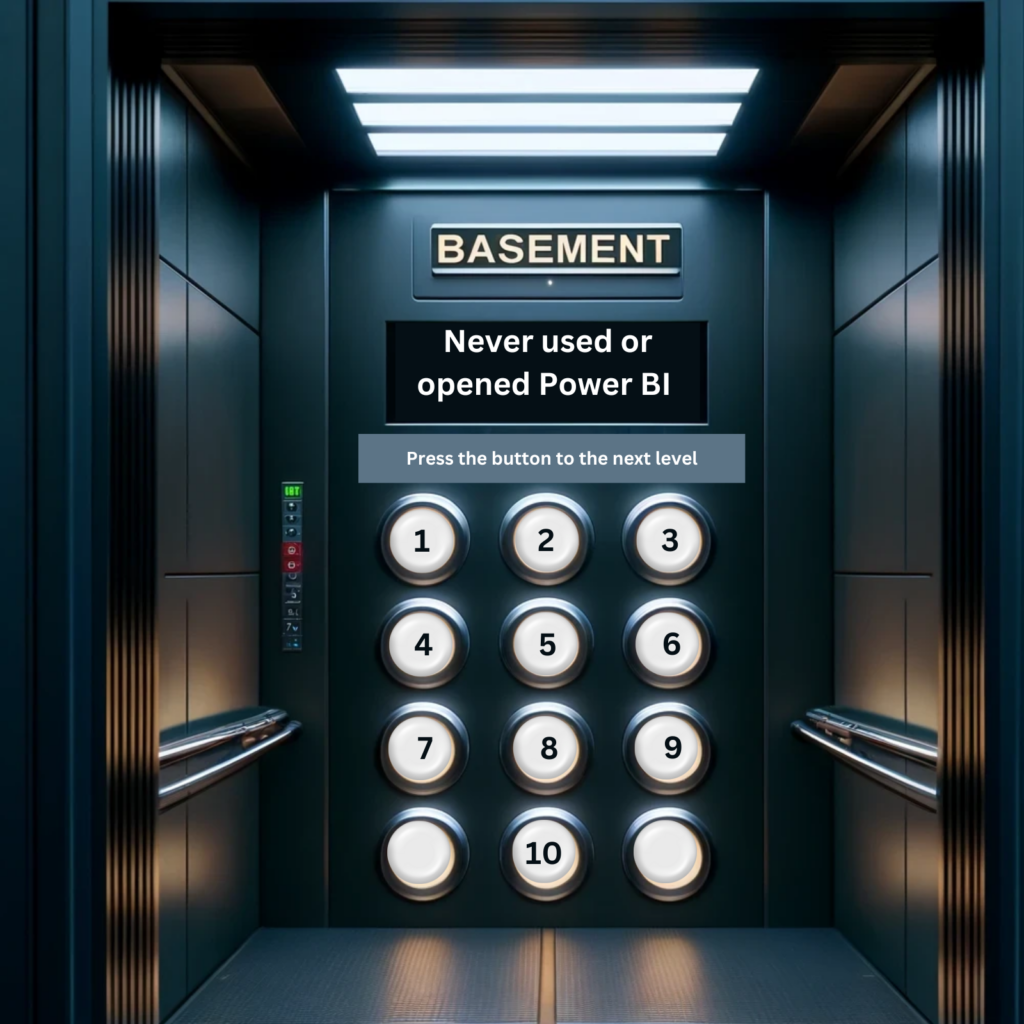
- Level 0: Absolute Beginner
Description: No knowledge of Power BI or its functions.
Indicators: Never used or opened Power BI. - Level 1: Basic Consumer
Description: Familiar with navigating and consuming pre-built Power BI reports.
Indicators: Can interact with reports using basic filtering and drilling functionalities. - Level 2: Basic Operator
Description: Understands how to refresh data and use straightforward data interactions.
Indicators: Can refresh data, use basic sorting, and understand report layouts. - Level 3: Data Explorer
Description: Begins to explore creating and modifying simple visuals.
Indicators: Can create basic charts and use “drag and drop” to adjust visual elements; familiar with the report canvas. - Level 4: Junior Analyst
Description: Can connect to and transform simple data sources.
Indicators: Understands how to connect to Excel and other simple databases; can perform basic data transformations in Power Query. - Level 5: Intermediate Analyst
Description: Capable of developing reports and basic data modeling.
Indicators: Can create calculated columns, basic measures using DAX, and set up simple relationships between tables. - Level 6: Skilled Modeler
Description: Proficient in complex data modeling and advanced DAX formulas.
Indicators: Can design star schema data models, create complex DAX calculations, and optimize model performance. - Level 7: Senior Analyst
Description: Utilizes Power BI service for collaboration and sharing insights.
Indicators: Regularly publishes reports, sets up dashboards, and uses Apps and Workspaces for collaborative purposes. - Level 8: Solution Architect
Description: Integrates Power BI with other applications and automates workflows.
Indicators: Proficient with using Power BI REST API, automating dataset refreshes, and embedding Power BI reports in applications. - Level 9: Expert/Trainer
Description: Mastery of Power BI’s capabilities, can administer Power BI environments, and trains others.
Indicators: Deep understanding of advanced features like row-level security, complex data governance, and training new users. - Level 10: Power BI Innovator
Description: Leads organizational strategy for BI and develops innovative solutions.
Indicators: Influences BI policies, contributes to the Power BI community, and develops new tools or templates recognized by peers.
With this framework, Diana now had a structured path to help her staff assess their current Power BI proficiency. The assessment tool allowed each team member to identify their level by matching their familiar functions to the appropriate indicators. Staff could now articulate their learning needs and chart a course forward, whether that was a basic introduction or mastering advanced data modeling techniques.
This clarity empowered Diana to strategically plan the next steps in her team’s learning journey. She collaborated with Jason to curate specialized courses tailored to each skill level, ensuring that everyone had the resources needed to advance their Power BI skills confidently and effectively.
