
excel dashboard pivot table
What skills are needed to create this Interactive Excel Dashboard?
To create the above dashboard, you need to have a good working experience of Pivot Table, Pivot Chart and Slicer. If you do not have know what they are, you can start by taking our Hidden Secrets of Data Analysis in Excel course. We will show you how to create and use a Pivot Table, starting with a set of raw unpolished data.
A more advanced course that will help you climb up the Excel Expert ladder is called the Secret Hacks of Excel Data Analytics for PMET.
Slicers are used to change the numbers on the pivot tables and charts
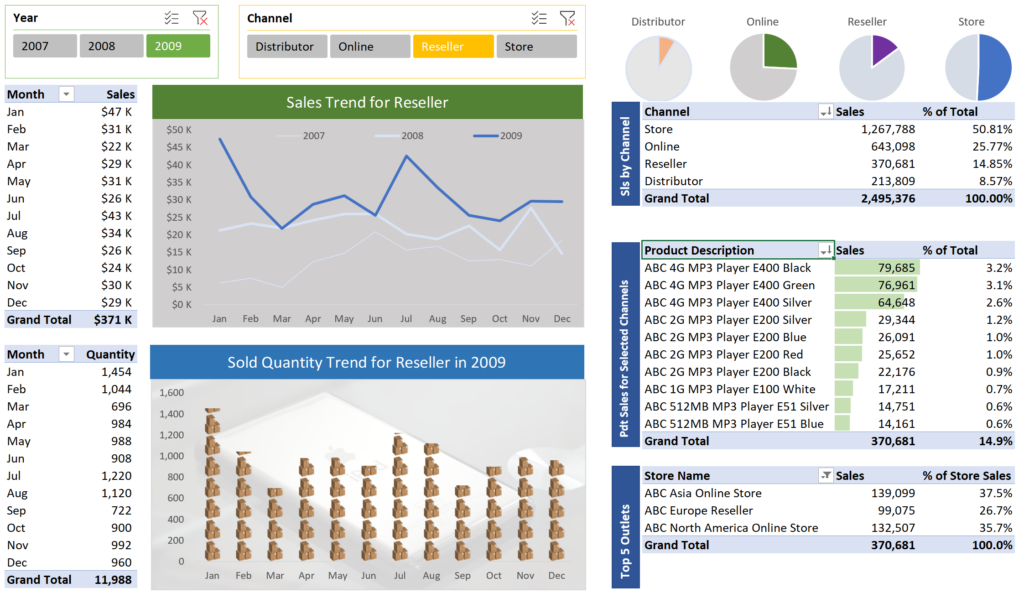
The monthly sales report and monthly quantity report are linked to the slicer. When you select any of the years in the slicer, the numbers will change according to the selection.
Background picture and special image are used to beautify the charts
The monthly quantity Pivot Chart displays the quantity sold for the selected year. It has a background picture to make the chart more professional looking. The pivot chart uses carter boxes for its columns. This is to break away from the conventional boring columns chart you are seeing all the time.
Interactive chart titles
The chart title for both the monthly sales quantity and sales are interactive and will change to display the channel and the year(s) of the slicers. The Interactive titles make use of the linked pictures from another worksheet as well as the new TEXTJOIN worksheet function.
Focus on the most important trend
The monthly sales chart in the dashboard is a line chart showing the trend for the last 3 years. The obvious thick solid blue line is the current year and the focus of the chart. Some bosses may want to compare the sales trend with previous years. Hence, we provided the 2 softer lines for the last 2 years so as not to overshadow the current sales trend which is still the most important trend to show.
The 4 pie charts offer the audience a good reference
Instead of drawing a pie chart to show the share of each channel to the overall sales, the dashboard offers 4 pie charts to give the bosses a good reference to the contribution. The pie chart offers a good reference to the contribution in terms of quarters. Is the sales channel contributing around a quarter, half, 3 quarters to the total sales? The pie charts are drawn using DAX so that there is no maintenance required when the slicer year changes. Using DAX, we can present the reseller sales against the other 3 sales channels to create the said pie charts.
Sales breakdown for the channels
The table below the pie charts offers bosses who prefer precise numbers over graphics the exact number for each sales channel. The table is sorted by sales from high to low. It shows that the physical stores are generating about 50% of the total sales for the company, followed by online, resellers, and lastly by distributors.
Text boxes are used to break away from the boring headers
The text box on the left of the table describes the purpose of the table. It is oriented to read sideways. Since it is not really needed most of the time, we make use of it to add some dimension to the dashboard.
Coloured bars are used in the Pivot Table
The second table on the right side of the dashboard shows the sales numbers of the products for the selected channel. It is also sorted using from high to low sales. Coloured bars are added into the Pivot Table to show bosses the gaps between the 10 products. If you notice in the dashboard picture, the top 3 products have similar sales numbers while the 4th to 10th products are way behind the top 3 products.
Another application of DAX (new way to do calculation in Pivot Table)
The percentage is calculated using another DAX so that we can find the percentage of the sales against the total sales for the company. This is why the total shows 14.9% instead of 100%. The 14.9% can be referenced back to the Pivot Table showing the sales by channel. The sales for resellers show 16.85%, round to two decimal places.
Top 5 Stores
The last table at the bottom right-hand side of the dashboard shows the sales contributed by the top 5 stores for the selected channel(s) (In this case Resellers). In the case of the reseller channel, there are only 3 stores. Hence there are only 3 line items showing 100% of the total sales for the reseller channel.
If you would like to learn how to create this dashboard, come for our Excel Pivot Table masterclass.