data value chain
Data Value Chain
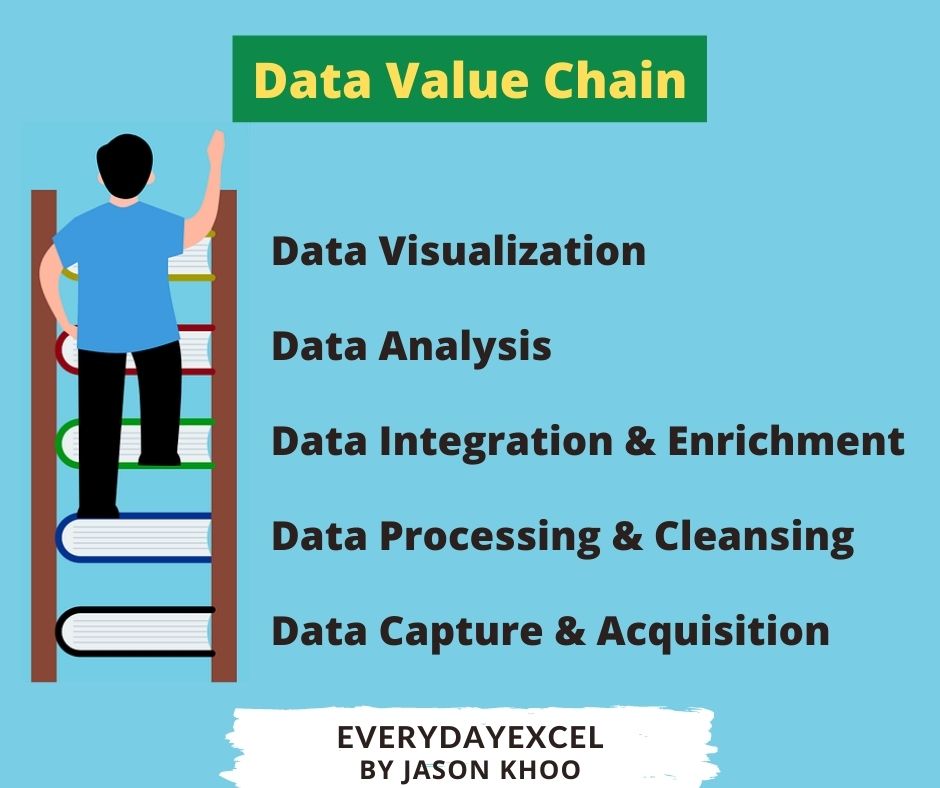
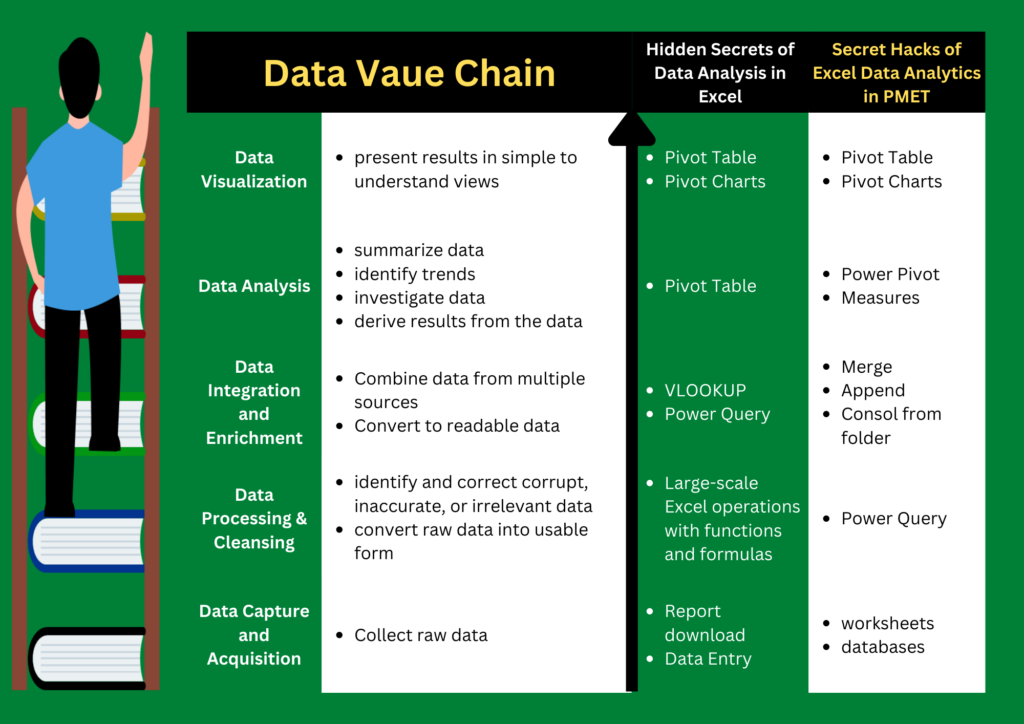
Data value chain describes the process of collecting raw data to data visualization. Data value chain can be divided into 5 main levels, Data Capture & Acquisition, Data Processing & Cleansing, Data Integration & Enrichment, Data Analysis and Data Visualization
The lowest level of the data value chain is Data Capture and Acquisition. With the rapid development of digitization, more data is collected electronically. More data is also readily for analysis. For the purpose of analysis, it is important for data/business users to be skilled in laying out the data to support the activities higher up the data value chain. Learn how to lay out the data for effective analysis.
The second level of the data value chain is Data Processing and Cleansing. Data collected manually and from systems is not perfect and has to be cleaned. This includes unwanted rows, columns, the layout of the data, splitting data into columns, and many more. In our Hidden Secrets of Data Analysis course, we make use of available Excel functions to complete this phase.
Moving to the third level of the data value chain, data integration and enrichment, you will need to make use of VLOOKUP to integrate 2 sets of data into one. VLOOKUP can also be used to enrich your data with more details. In our higher-level course Hidden Hacks of Excel Data Analytics for PMET course, we make use of Power Query Merge and Append functions to combine 2 or more sets of data into one.
In level 4 of the data value chain, we make use of Pivot Table to analyze our data. In the Hidden Hacks course, we make use of Power Pivot which allows us to perform advanced calculations in Pivot Table. Calculating YTD and variances are made possible with the use of Power Pivot. We can even link 2 sets of data into one.
The 5th and final level of the data value chain is data visualization. We can make use of Pivot Charts to present our findings and convey the message in an easy-to-comprehend form. The use of slicers, data bars, will make our Pivot Charts and Pivot Tables more professional looking.
The majority of Excel users are stuck at level 1 and 2 of the data value chain. If you are considering a course in Excel, make sure that it covers all 5 levels of the data value chain.
Hidden Secrets of Data Analysis in Excel makes use of Excel formulas and functions to move up the data value chain. It is good for users who are working with a single set of data.
Hidden Hacks in Excel Data Analytics for PMET can handle more than 2 sets of data and makes us of Power Query and Power Pivot to move up the data value chain.