data analysis
What’s next after Hidden Secrets of Data Analysis in Excel?
If you have attended our Hidden Secrets Excel course before, then you should know how to use VLOOKUP and create a simple Pivot Table.
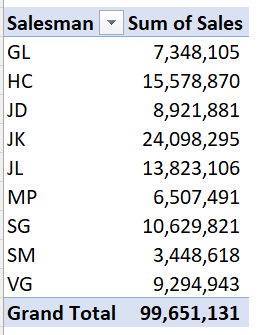
Simple Pivot Table
A simple Pivot Table is a report showing a total sum or total count with a breakdown of the numbers by category. It is a fast and safe way to create your report. You can create your report in just a few seconds without editing your data at all. The calculation is auto-generated without using any formula. Pivot Table is a great alternative to the Subtotal function.
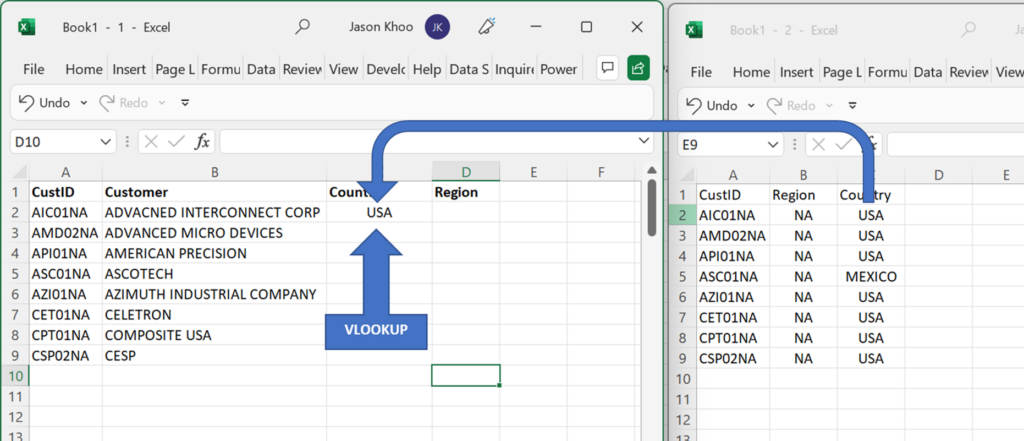
VLOOKUP
VLOOKUP has many purposes but in data analytics, it is mainly used to link the data from a second worksheet to the master sheet. It is a great function to add more categories to your master data.
But that is not all in our Hidden Secrets course. You will also acquire skills to
- extract data from columns,
- manage dates in Excel,
- create new groupings in your data,
- Pivot Charts.
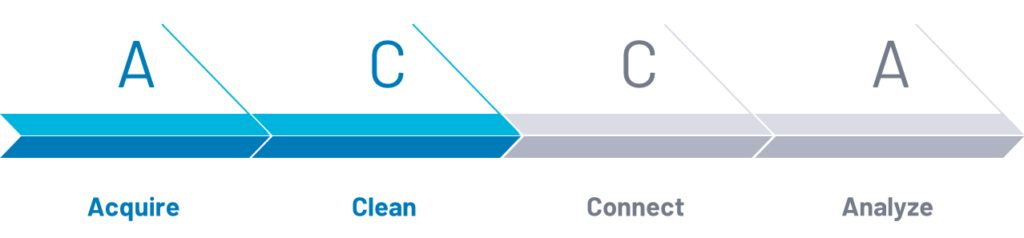
The course is designed to bring you through the whole process of data analytics as a beginner, that is acquire, clean, connect and analyze your data. Plus how to present your data in the tables and charts.
New Skills after learning Pivot Table and VLOOKUP
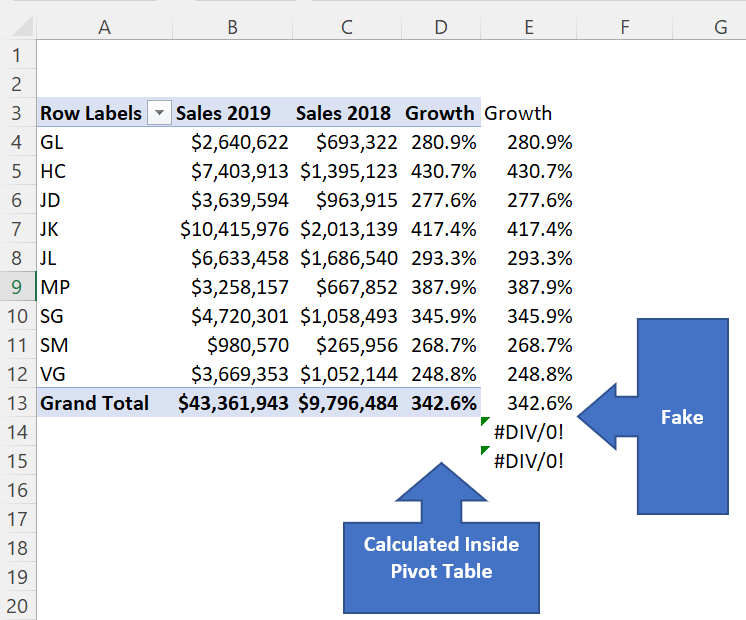
Advanced Pivot Table
If you have mastered Pivot Table and all the functions related to data analytics beginner’s level, then you are likely to be ready for more advanced Pivot Table reports. In Advanced Pivot Table reports, you can compare two columns side by side with a third column showing the difference between the two. Advanced Pivot Table allows you to create MTD, QTD and YTD numbers, without modifying your source data. Everything is taken care of right inside the advanced Pivot Table.
Power Query
Another time-saving function you could learn is Power Query. It is a great time-saving tool to
- get data from multiple sources (excel, csv, access, SQL server, json, etc),
- combined the data sources,
- extract data,
- remove unwanted columns,
All on auto mode. There is no programing involved but you can automate what you have been done. Save you tons of time especially if you need to constantly download the raw data to get an update for your reports. And the coolest part of Power Query is that you only need to set up your report once and you can get your updates as many times as you want without doing everything all over again.
You can learn about Power Pivot and Power Query plus data analytics in this new course we have just launched this year. It shows you how to get started with Power Query and Power Pivot. It is a course that will keep your skills relevant for the next 5 years. I believe it is recession-proof too. Check it out here https://www.everydayexcel.com/data-analytics/