A Case Study of Applying the Data Analytics Framework for Business Decision Making
It May Seem Simple, But It’s Not: Deciding on the HealthShield Rider

At first glance, the decision appeared straightforward—should I purchase the rider for my HealthShield plan or not? However, as I requested more details to better understand the implications of adding the rider, I was bombarded with an overwhelming amount of information. Different scenarios, varying costs, and complex terms left me completely lost in a sea of data.
Rather than letting confusion take over, I decided to apply the Data Analytics framework to make sense of the situation. The Data Analytics framework isn’t just about crunching numbers—it’s a systematic process that helps you cut through distractions, clarify problems, and arrive at well-informed decisions. By using this approach, I was able to confidently decide whether purchasing the rider made sense for me. Here’s how it worked when applied to the HealthShield decision—and how you can use the same method to tackle your personal or business dilemmas.
How I Used the Data Analytics Framework to Decide on the Rider
Step 1: Define the Problem Clearly
Before diving into the analysis, I needed to clearly define what I already had and what options were available to me. My current coverage included MediShield Life (a government-mandated basic health insurance plan) and HealthShield (an integrated shield plan offered by private insurers). The question was whether adding the optional rider—which enhances coverage but increases premiums—would provide enough value to justify the additional cost.
To break this down further:
- What do I have?
- MediShield Life : Provides baseline hospitalization coverage, including subsidies for public hospitals and capped payouts based on ward class.
- HealthShield : Builds on MediShield by offering higher claim limits, private hospital coverage, and other enhancements.
- What can I do with them?
Together, these plans cover most medical expenses, but gaps remain depending on factors like ward choice, deductibles, co-insurance, and out-of-pocket costs. Adding the rider could potentially reduce those gaps—but at what cost?
This step helped me focus on understanding how each component works and where the rider fits into the bigger picture.
Step 2: Collect Data to Understand How MediShield and HealthShield Work
The next step was to gather detailed information about both plans. This involved breaking down a typical hospital bill into its components to see how each part is covered:
- Government Subsidy : Public hospitals offer significant subsidies for Singaporeans, especially in lower-tier wards (e.g., B2/C wards).
- Deductible : The initial portion of the bill that must be paid out-of-pocket before insurance kicks in.
- Co-Insurance : After the deductible, patients typically pay a percentage (e.g., 10%) of the remaining bill.
- MediShield Payout : Covers a portion of the bill after deductibles and co-insurance, up to certain limits depending on ward class.
- HealthShield Payout : Enhances MediShield coverage, often covering private hospitals or higher-tier wards, and may include additional benefits like outpatient treatments.
With this foundation, I began analyzing different scenarios based on ward choices (C, B2, B1, A, Private) and potential medical bills.
Step 3: Analyze Scenarios Using Different Wards
To truly evaluate the impact of the rider, I tested various real-world scenarios. For example:
- Scenario 1: Staying in a Subsidized Ward (C or B2)
- Scenario 2: Opting for a Higher-Tier Ward (B1 or A)
- Scenario 3: Choosing Private Hospital Care
For each scenario, I calculated total annual costs (premiums + deductibles + co-insurance) versus potential savings from reduced out-of-pocket payments. This allowed me to compare the financial impact of having vs. not having the rider under different circumstances.
Step 4: Analyze Real-World Data Using an Actual Hospitalization Bill
To ground my analysis in reality and ensure the insights were applicable to real-life situations, I turned to a detailed example of a hospitalization bill published in The Straits Times. The case involved a 60-year-old Singaporean who underwent an 18-day hospital stay for a hip replacement at a private hospital. The total bill amounted to $36,750 , broken down as follows:
- $18,000 : Daily ward and treatment charges
- $12,750 : Surgical procedure fee
- $6,000 : Cost of the implant
This real-world scenario provided a concrete foundation for understanding how MediShield, HealthShield, and the optional rider would interact with such a significant medical expense. Here’s how I used this data to analyze the impact of each component and evaluate whether the rider was worth the investment.
Step 4.1: Break Down the Bill Across Coverage Components
Using the breakdown of the $36,750 bill, I mapped out how each part would be covered under different scenarios—specifically, across various ward classes (C, B2, B1, A) without the rider. This step allowed me to see exactly where subsidies, deductibles, co-insurance, and insurance payouts came into play.
Step 4.2: Create Stacked Column Charts to Visualize Cost Distribution
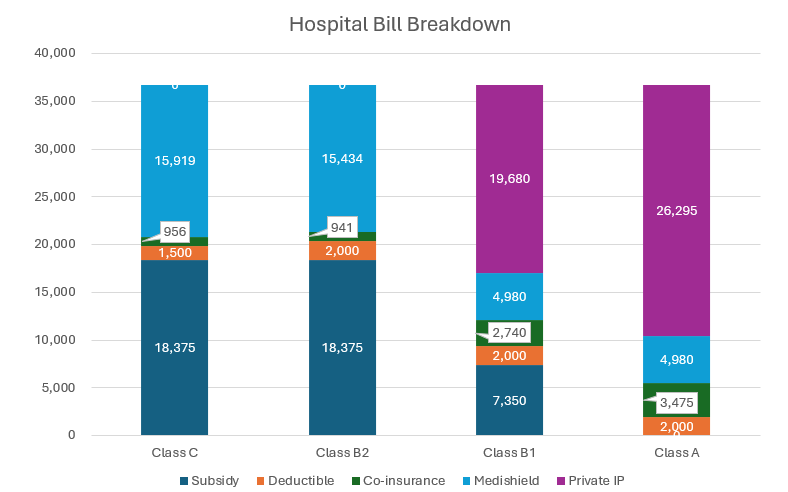
To simplify the analysis, I created stacked column charts that illustrated how the $36,750 bill was distributed across different components (subsidies, deductibles, co-insurance, MediShield payouts, HealthShield payouts, and out-of-pocket costs). Importantly, I kept the total bill constant across all ward types for comparison purposes, even though actual costs vary by ward. This approach helped me focus on the proportions paid by each party rather than getting distracted by absolute numbers.
Step 4.3: Isolate the Impact of the Rider
To determine whether the rider was truly worth the cost, I isolated the portion of the bill directly affected by the rider—namely, the co-insurance and any uncovered expenses. By focusing on this segment, I quantified the exact financial benefit provided by the rider in each ward type.
Step 5: Arrive at a Decision
After completing the analysis, I arrived at the following insights:
- If I planned to stay in subsidized wards (B2), the rider wasn’t necessary since government subsidies and existing coverage kept costs manageable. The out-of-pocket expenses amount to $2,456 equivalent to the premium of $2,440. $2,456 is only incurred if hospitalization is needed while $2,440 has to pay every year.
- If I anticipated needing care in higher-tier wards (B1 or A), the rider became increasingly valuable due to its ability to reduce co-insurance burdens. The out-of-pocket expenses amount to $5,475. With a rider of $2,440 pay annually, the out-of-pocket expenses is reduced to about $1,740. Total amount paid to have the rider is $4,180, a saving of $1,300 for the year of hospitalization. The saving is only valid on the year of the hospitalization. Other years, you have to pay $2,440 for the rider.
Ultimately, I decided against purchasing the rider because the incremental cost of the rider outweighed the marginal benefits for my situation.
Why This Approach Works
The Data Analytics framework proved invaluable in cutting through the complexity of healthcare plans. By defining the problem, collecting relevant data, analyzing scenarios, and visualizing insights, I gained a clear understanding of the trade-offs involved. More importantly, the process ensured my decision was grounded in logic rather than emotion or guesswork.
Whether you’re evaluating insurance riders, optimizing business operations, or making personal financial decisions, this structured approach can help you navigate uncertainty with confidence. Start small, stay focused, and let the data guide your way.
Interested in equipping you or your team with data analytics skills? Check out this “Mastering Problem Solving with Data Analytics” course we are organizing.