Mastering Data for Business: Leverage Excel for Strategic Insights, Drive Growth
  • Case Studies
  • Data Challenge
  • Our Courses
  • Our Customers
  • Testimonies
  • Contact Us
  • Case Studies
  • Data Challenge
  • Our Courses
  • Our Customers
  • Testimonies
  • Contact Us
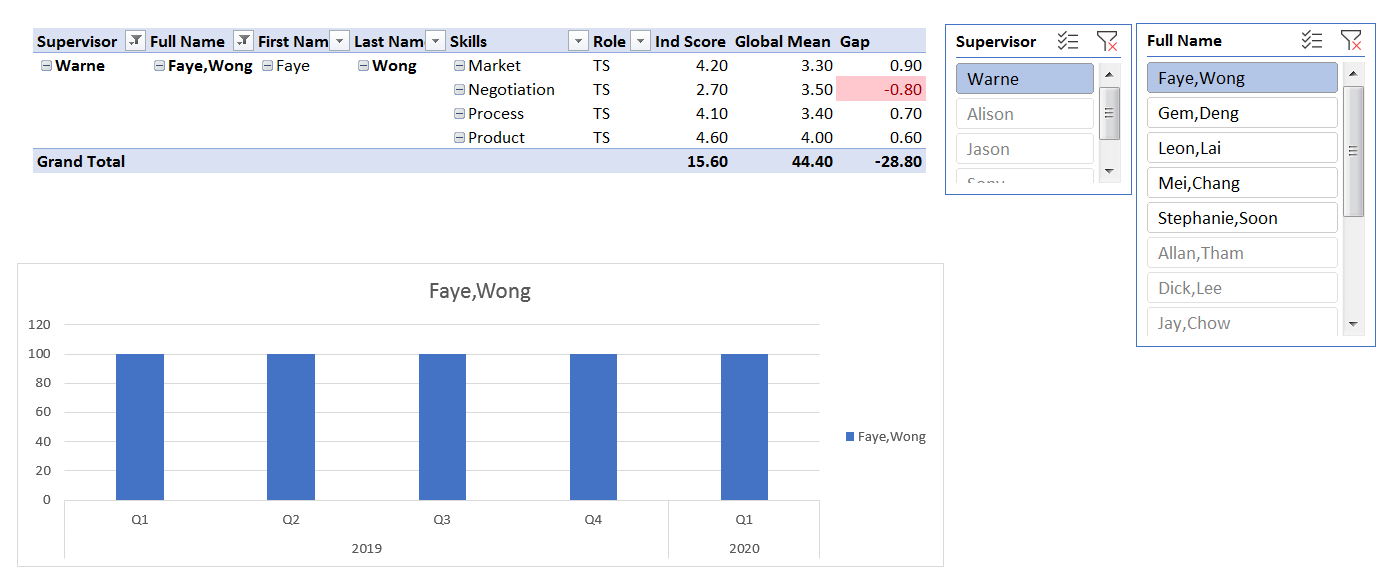
  • Green bar in Power Query

    Did you see the green bar in the picture? It is just below the header. These 2 columns have different green bars. One is a complete green bar while the other is shared with a grey bar. The green bar is an indication that the list in that column. If the green bar is full, it means that all the values are displayed. But if the green bar is shared with a grey bar, this means that some of the values are filtered. Actually, there is another colour. It’s red. When it appears, it means that the column contains error values.

    read more

    You May Also Like

    What is a good visual

    December 7, 2020

    3 New Ways to present a Hair Salon Sales Dropped by 50% in Excel

    February 25, 2020

    How to create a professional employee evaluation report without repetitive copy and paste

    May 28, 2020

Our Courses

Unleash the Power of Excel in Procurement and Supply Chain Management. Join our Masterclass to Drive Growth and Gain Strategic Insights.
Learn Excel with a goal in mind. With a specific goal, it is easier to remember what you learn and apply the functions to your work. This is how we have designed Hidden Secrets of Data Analysis in Excel
© 2007-2025 everydayExcel Business Lab Pte Ltd
ashe-child Theme by Jason Khoo.