-
3 Major Difference between Pivot Table and Power Pivot Table
1a. Pivot Table can only accept a single source of data. 1b. Power Pivot Table can accept multiple sources of data. 2a. Pivot Table can only do simple summary such as Sum, Count, Max, Min 2b Power Pivot Table can do complex calculations 3a. Pivot table can only accept data from the entire source (worksheet) 3b Power Pivot Table let you pick choose the columns from source to be included in the report
-
3 Presentations You Don’t Know You Can Do In Pivot Table
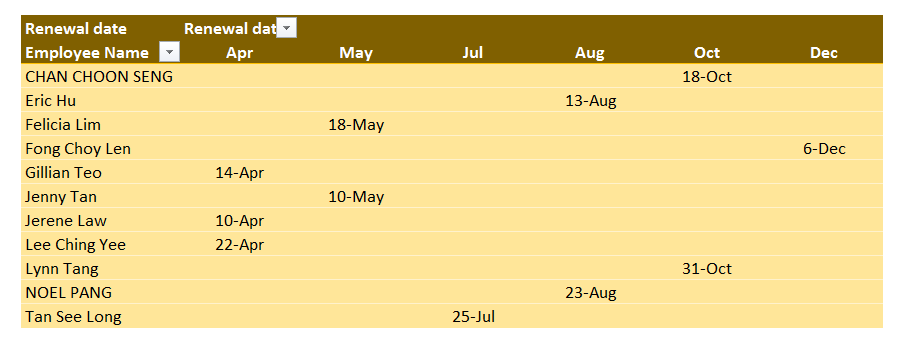
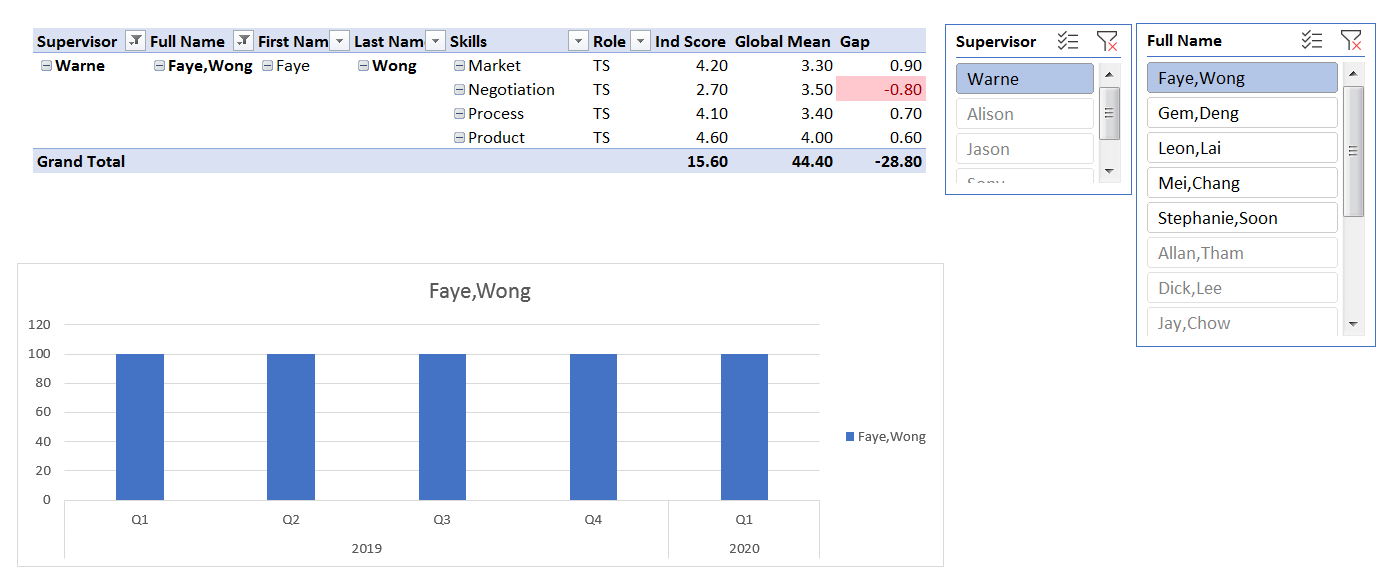
1. You can create Bar Chart in Pivot Table Bar Chart in Pivot Table 2. You can perform unique count without calculations Unique Count in Pivot Table 3. You can present dates in the report Present Dates in Pivot Table
-
3 core skills you will acquire in our business data training
I am conducting our most popular Excel course titled “Hidden Secrets of Data Analysis in Excel” next week on 5 & 6 March 2020. It is not a typical Excel course which just showed you how to use some popular functions and formulas in Excel. This “Hidden Secrets” course will also impart skills on how to manage your database, a skill that is not available in most if not all Excel courses. To be able to prepare your reports, you need to have at least a basic sense of how databases worked. This will help you manage your data more efficiently, create more dynamic Pivot Table for analysis and reporting.…
-
3 New Ways to present a Hair Salon Sales Dropped by 50% in Excel
-
3 Key reasons why you should know which version of Excel you are using
1. You can do Unique Count in Pivot Table if you have Excel 2013 and above 2. You can combined data from multiple worksheets in one from Excel 2016 3. You can do away VLOOKUP, MID, Text to Columns from Excel 2016 1. Unique Count in Pivot Table The pivot table used to be able to count the number of records in the data source. If the same name appears 10 times in the data source, Pivot Table will count the name 10 times. There are times when you wish to count only the 10 names once and display as one count. If this is the problem you are facing,…
-
You have 3 options
A General Manager of a reputable corporation came for my Hidden Secrets of Data Analysis in Excel Training. I asked him “What do you hope to learn from the course?” It is a standard feature in my training is to ask them what they hope to achieve in the training so that I can customize it as much as I can to help them. His reply was “My staff said the reports he wanted cannot be done in Excel. I am here to verify it. The outcome is “It can be done.” You may think that this general manager didn’t trust his staff. But I think that he had probably…
-
3 reasons why Excel is rejected for big data
-
3 reasons why I created an interactive map chart
-
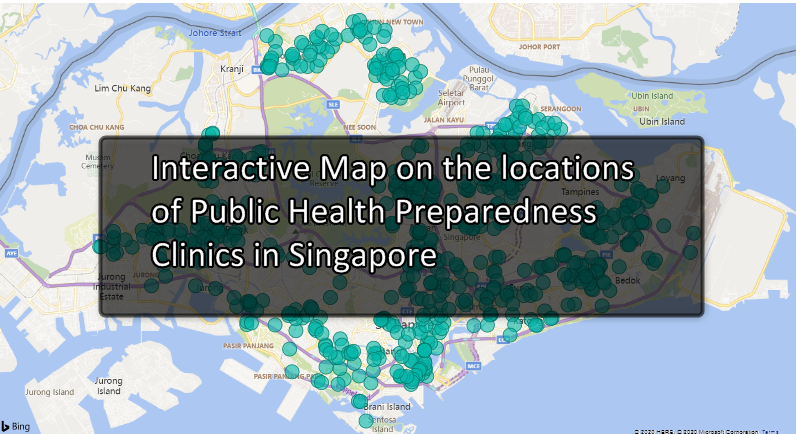
Finding a Public Health Preparedness Clinic near you with an interactive map
The Public Health Preparedness Clinics (PHPCs), as well as polyclinics, will provide special subsidies for Singapore Citizens and Permanent Residents diagnosed with respiratory illnesses (e.g. common cold).Please bring along your NRIC or birth certificate, along with your PG/MG/PA and CHAS card, where applicable. To find one near your place, use the interactive chart given below. If you are using Mobile, Double tab to zoom in. Press and hold one of the green dot to show clinic name and contact details. If you are using Desktop, Use the mouse scroll wheel to zoom in. Mouse over one of the green dot to see more details. Full screen chart can be accessed thru this link. This map is…
-
What is Business Data?